If you’re a marketer in 2024, chances are you’re on the influencer marketing train. Influencer marketing has taken the digital marketing world by storm. And there’s no sign of its marketing power diminishing anytime soon. As the industry continues to change and evolve, marketers like us need to stay on top of the latest influencer marketing stats. That way we can create winning campaigns using the most cutting-edge strategies. Luckily, we’re here to help with just that.
In this post, we’re breaking down the essential influencer marketing stats on a global scale. We’ll cover worldwide social media benchmarks and influencer marketing trends. And we’ll dig into some of the ongoing challenges facing the industry. We’ve compiled these 25 essential influencer marketing stats so you can take them with you into your next campaigns. Read on to discover insights that will help you navigate the wild world of influencer marketing in 2024.
How Influencer Marketing Changed the Digital Landscape
When it comes to influencer marketing, things change fast.
There have been historical shifts in how we communicate, how we socialize, how we make decisions, and how we shop. And these shifts directly impact the influencer marketing industry as a whole. But even with the constant changes, influencer marketing is so effective that it’s become an integral part of social media marketing.
When we first published a skyscraper stats roundup back in 2019, about 2 in 3 marketers were planning to add influencer marketing to their budgets. Most companies were still trying to figure out influencers. And luxury brands were still trying to decide if an ecommerce site to make shopping more convenient for customers would simultaneously erase the luxe exclusivity they’d worked so hard to build into their respective brands.
Fast forward to 2024, and ecommerce is non-negotiable. Influencer marketing campaigns are run by 9 in 10 brand marketers. And influencers – well, many companies still struggle with the influencer selection process, but we can help with that.
Influencer marketing is such a big deal because it allows brands to get in front of large groups of niched-down segments of their target audience by forming alliances with the most influential people in those segments. These days, there are millions of influencers across a wide range of ever-evolving platforms. You can target just about anyone if you’re on the right social media platform and partnered with the right influencers.
The global influencer marketing industry is expected to top $24 billion by the end of 2024. A few years ago, experts were predicting the industry would only reach $15 billion by 2024, but the popularity of influencer marketing pushed the industry past that number in 2022.
Global Social Media Benchmarks You Need to Know
It’s no secret influencer marketing moves the needle around the world. Check out these international influencer marketing stats so you’re up to date on the industry at home and abroad.
1. About 5 billion people use social media around the world.
Statista estimates there are 5.44 billion internet users around the world, accounting for 63 percent of the global population. Of those who are online, nearly 93 percent (or 5.07 billion people) are also using social media.
2. The average person spends nearly 2.4 hours a day on social media.
The average amount of time we spend on social media globally is about 2 hours and 23 minutes. That’s down from 2 hours and 31 minutes in 2023, so maybe those screen time reports really are working. Of course, time spent varies pretty significantly depending on where you happen to be in the world. In the US, the average amount is 2 hours 16 minutes. That’s significantly lower than the global leader, Brazil, which averages more than 3 hours and 49 minutes per day.
3. 46% of Gen Z prefer social media over search engines for researching brands.
Social platforms are gaining a greater share of the search activity when it comes to researching brands. About 46 percent of Gen Z (that’s 18 to 27-year-olds) use social media as a primary source of information when researching brands. Meanwhile, 35 percent of Millennials (ages 28 to 43) prefer social media to search engines.
4. In 2024, more than 8 in 10 marketers surveyed say influencer marketing works.
That’s right. 85 percent of survey respondents say they believe influencer marketing to be an effective form of marketing.
5. The ROI on influencer marketing exceeds 5X for each dollar spent.
For every dollar spent on influencer marketing, the ROI ranges between $5 and $6. The 2024 average sits at about $5.78 return on every dollar spent. It’s the type of ROI that no brand should snooze on.
6. The top brands that use influencer marketing earn 20x ROI.
If you thought that average was impressive, get a load of this. The top 13 percent of businesses using influencer marketing techniques make a whopping $20 return on every $1 spent. It pays big to have winning influencer marketing campaigns.
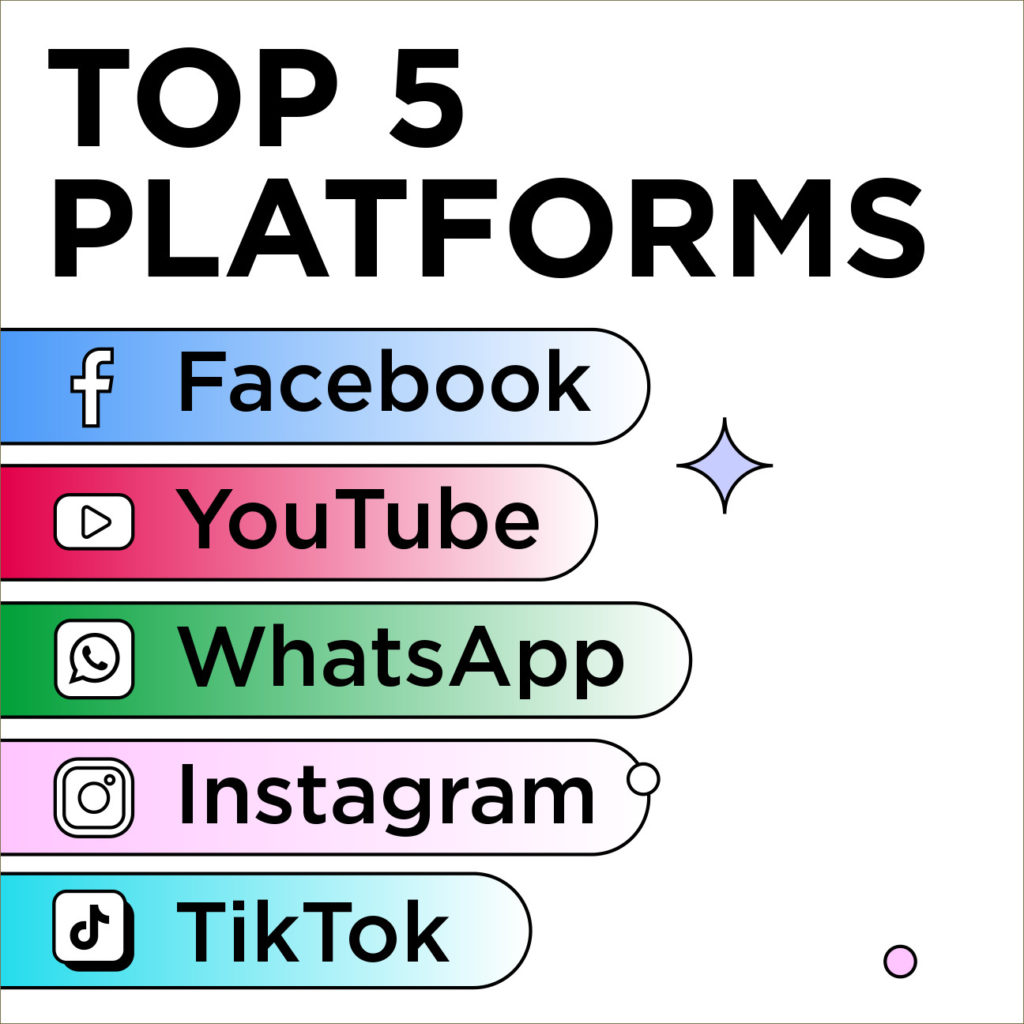
7. Upwards of 81% of US marketers plan to use Instagram in their influencer marketing campaigns.
Instagram is the preferred social media channel for influencer marketing campaigns. And it’s maintained its reign despite industry changes like the introduction of TikTok. In 2024, 80.8 percent of marketers intend to leverage Instagram in their influencer campaigns. You can compare that to the 97 percent of marketers who leveraged Instagram for influencer campaigns back in 2020 before TikTok’s interest graph changed the way we all social. Although Instagram may keep its lead, other platforms are gaining notable momentum, namely TikTok, YouTube, and Snapchat.
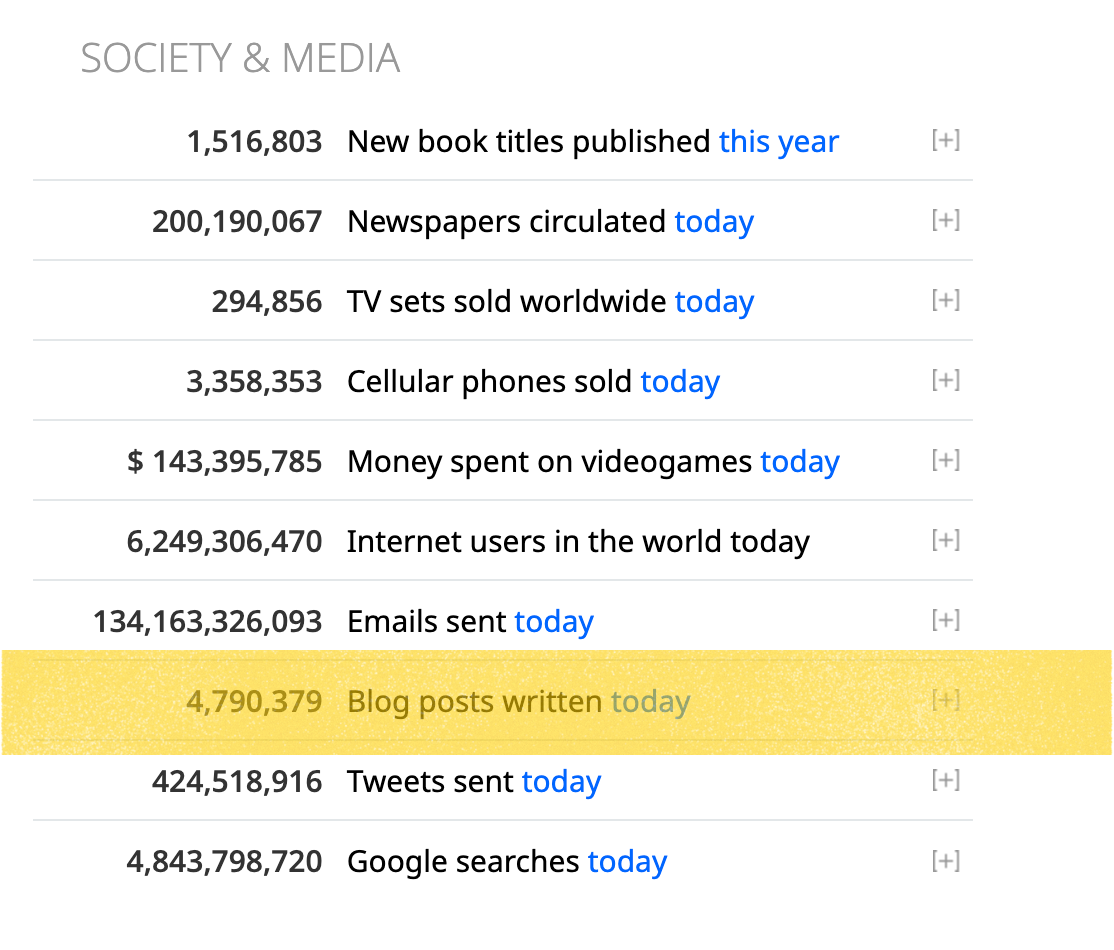
8. Over 2.5 billion blogs are published each year.
This stat is an oldie, but goodie. Since 2017 more than 100 blog posts go live every second. In 2024, that racks up to that 2.5 billion figure.
According to Worldometer blog post clock, this many 👇🏽 blog posts have been published today, July 9th, 2024, around 10:30 am PST.
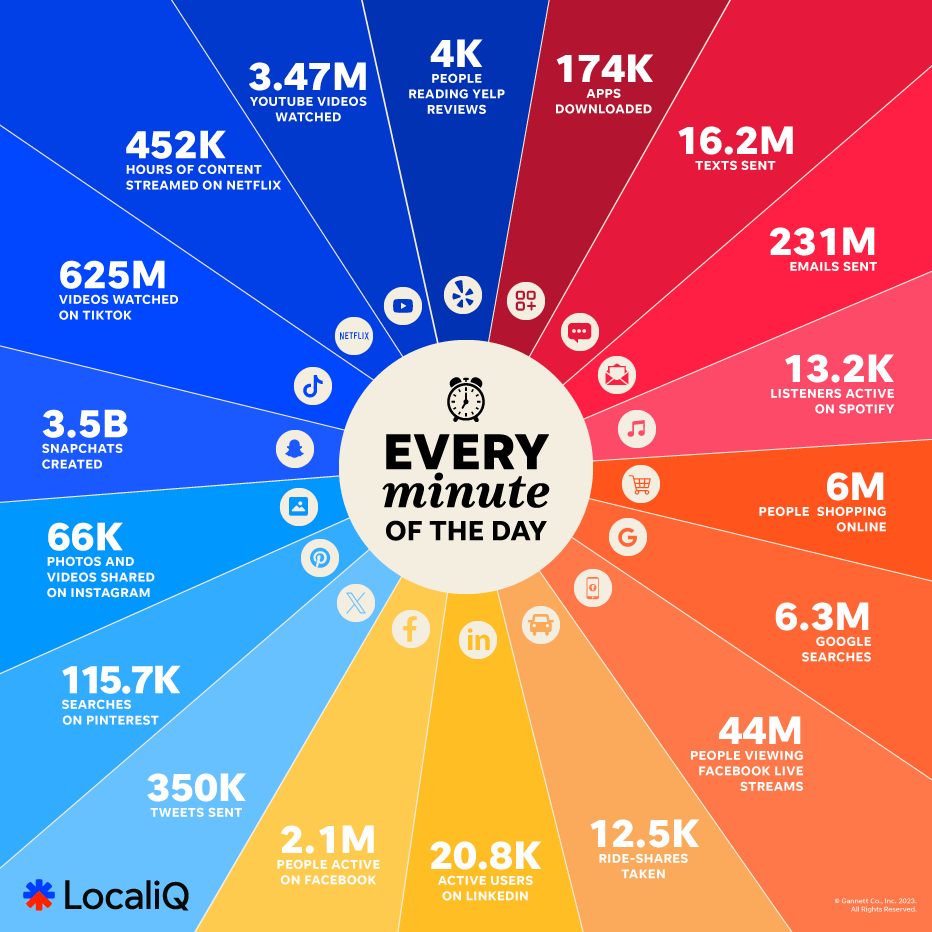
9. More than 25 million hours are spent online globally per minute.
According to Statista, as of December 2023, an internet minute contains 25.1 million hours spent online. That’s counting all users across the globe. It’s safe to say the internet age is alive and well.
10. Tens of millions of pieces of user-generated content are published to platforms every single minute.
3.5 billion snaps show up on Snapchat in a minute. 4 million pieces of content get shared on Facebook. 360K tweets echo through Twitter. And about 66K posts go up on Instagram every minute (based on an old stat from Wordstream that reported 95 million pics and videos were uploaded to Instagram every day). That’s A LOT of content.
11. Nearly 7 in 10 marketers plan to increase their influencer marketing budget this year.
A substantial 69 percent of marketers planned to increase their influencer marketing budget in 2024. It makes sense why. Influencer marketing is an accessible strategy with ample returns on investment.
12. A majority of brands — 64% — prefer working with smaller creators.
Nano-influencers are a popular choice for marketers these days. They boast the highest engagement rate of all the influencer marketing tiers at 4.39 percent. And they are usually more affordable to work with than their mega-influencer counterparts.
13. In 2024, influencer marketing is a $24 billion industry.
We mentioned this figure at the top, but it’s worth repeating. By the end of this year, the influencer marketing industry is set to top $24 billion. Last year, marketers spent $4.5 billion working with influencers and saw big returns. Those numbers are expected to climb this year as more and more marketing teams jump aboard the influencer marketing train.
14. Most marketers say influencer-generated content performs better than in-house efforts.
A healthy 63 percent of marketers report that content created by influencers through their influencer marketing partnerships performs better than their brand-directed assets. Here at The Shelf, we’re known to compare influencer marketing to a new and improved form of word-of-mouth advertising. And this confirms our suspicions. Consumers want recommendations they can trust. That means more content that feels organic and less that feels like traditional ads.
15. TikTok and Instagram are the influencer marketing top dogs for 2024.
We all know short-form video has taken the internet by storm. 94 percent of brands plan to invest in more video content this year. TikTok reigns supreme with 89 percent of creators prioritizing the platform over Instagram. But Instagram is not to be ignored. 90 percent of brands intend to beef up their Instagram presence this year.
Ongoing Challenges with Influencer Marketing
The trajectory for influencer marketing continues to dazzle. But like any industry, it’s not without kinks. Whether it’s adequate campaign analysis or managing your influencer partnerships, the influencer marketing industry continues to pose old and new challenges for brands and creators alike.
One thing we can always count on is change. And, that’s about it. The influencer marketing landscape is ever-changing. That’s why it’s important to keep a finger on the pulse, so you’re always a step ahead of the curve. These influencer marketing stats should highlight some common pitfalls in the industry.
16. 34% of teams simply don’t measure the ROI of their influencer marketing efforts.
Yikes, right? 34.2 percent of respondents said they rarely or never measure the ROI of their influencer marketing investments. And that number has increased from 33 percent in 2023.
Not tracking the ROI of influencer campaigns means it will be difficult to quantify the impact of sponsored content on sales or reach. While influencer marketing platforms and other software continue to make it easier to track and analyze the data, this can still pose an issue depending on the campaign, partnerships, platforms, etc.
17. Only 40% of brands pay influencers in monetary compensation.
Influencer marketing is a powerful tool for most any brand. Influencers who create content that brings in big returns deserve to be compensated for their efforts. Disappointingly only 40.8 percent of brands compensate influencer partners with cash payments. 30.8 percent pay in free products. 18.9 percent offer discounts. And 9.4 percent compensate influencers with giveaways.
If freebies is your strategy, it’s time to read the room. Creators and social media platforms have matured past the point of providing brands “free” content in exchange for free stuff. And rightfully so.
18. 50% of marketers struggle to manage influencer campaign logistics.
Managing a wide array of influencer partnerships is no easy feat. Influencer Marketing Hub mentions the difficulties in tracking the activity of your influencers. It’s a lot to juggle: influencer discovery, selection, contracts, deadlines, permissions, etc.
Luckily, there are platforms that can help. Agencies (like the fine folks here at The Shelf) can often take care of the tracking, strategizing, creative concepts, and all the things.
19. 67% of brands are worried about influencer fraud.
Sometimes, everything isn’t as it seems in influencer marketing. Over half of respondents in a survey have trouble spotting fake followers or engagement. This can add a new level of difficulty when building authentic relationships for long-term partnerships. And yes, this is still a concern. Reportedly 38 percent of influencers artificially increase their followings.
20. 57% of in-house teams use third-party platforms to run their influencer campaigns.
Human resources, tech, bandwidth… influencer campaigns are made up of a lot of moving parts. It makes sense that most brands need a bit of help. However, in 2024, 76 percent of influencer marketing campaigns are run in-house. That’s a significant increase from recent years.
21. 1 in 3 brands have a hard time finding the right influencers for their campaigns.
When surveyed, 34 percent of marketing teams said finding the right influencers for their campaigns is a HUGE pain point. That’s down from 75 percent in 2020. But influencer selection is still a major issue.
22. 49% of marketing teams get stumped when things change on social media platforms.
Nearly half of marketers cite algorithm and social trend changes as their biggest pain point when it comes to influencer marketing. Especially if you’re already in the planning stages of an influencer campaign. Or worse, you have an active campaign running. That’s why posts like these that round up all the latest influencer marketing stats are essential.
23. Nearly 3 in 10 marketing teams struggle to keep up with social media trends.
28 percent of marketers worry about keeping up with trends. Who doesn’t? If you’re not getting a daily dose of podcasts and headlines feeding you updates, it’s easy to fall behind. Trends literally change in an instant. But never fear, we’re experts at keeping up to date. You can always check in with us for the latest and greatest influencer marketing stats and trends.
24. 30% of marketing teams want to reduce the time spent managing influencer marketing campaigns.
The average influencer marketing activation lasts anywhere from three to five months from contract signing to wrap report. Working with an influencer agency or third-party platform can help reduce your team’s time spent managing and monitoring current campaigns so you can focus on strategizing your next one.
25. Only 37% of marketing teams prioritize always-on, long-term influencer marketing campaigns.
With factors like rising influencer costs, more nuanced influencer marketing contracts, and brand safety concerns, long-term campaigns and influencer-brand relationships are becoming more and more beneficial in our space. It’s essential to make lasting influencer relationships built on trust. Agencies like The Shelf can help with that.
More 2024 Influencer Marketing Stats to Check Out
We’re breaking down all the hottest influencer marketing stats of 2024 just for you. If you frequent our site, you’ll see these posts going live throughout the year. But for ease of use, we figured we’d round them up for you here. Bookmark this post, and we’ll update this list as new influencer marketing stats posts go live. So far, you can check out our posts on the following:
- Instagram Stats
- TikTok Stats
- Pinterest Stats
- Facebook Stats
- Consumer Dynamics Stats
Wrapping Up the Essential Influencer Marketing Stats
We hope you found these influencer marketing stats as essential as we did. In the ever-changing world of influencer marketing, staying up-to-date on the latest figures is key to creating winning campaigns. Here at The Shelf, we’ll always keep you posted on the latest and greatest in our industry. We’re big data people. So if you’re looking for numbers, we’ve got you covered.
If you’d like support putting these influencer marketing stats into action in your next campaign, we can help. Schedule a strategy call with one of our experts today. We’ve helped countless brands develop goal-getting campaigns using data-driven techniques and our pulse on the industry. We’d love for yours to be next.

About This Author
Ariana Newhouse | B2B Writer
I am a freelance writer and comedian based in Los Angeles. While making people laugh is my jam, it’s not always the company brand. So, I strive to make people feel something. My writing philosophy is collaborative, empathetic, and humanistic. At the end of the day, no matter the message, there are real people on both ends of the process.