TL;DR
Your CEO asks, “How much incremental revenue did we actually drive from the influencer campaign this quarter?” You’ve engagement rates, clicks, maybe a TikTok your team even loved, but not a number the CFO can hang a forecast on. That’s the enterprise influencer marketing measurement gap. And it’s why influencer marketing often gets sidelined at budget time. Influencer marketing KPIs are about proving it deserves the same budget conversation as paid search. The framework:
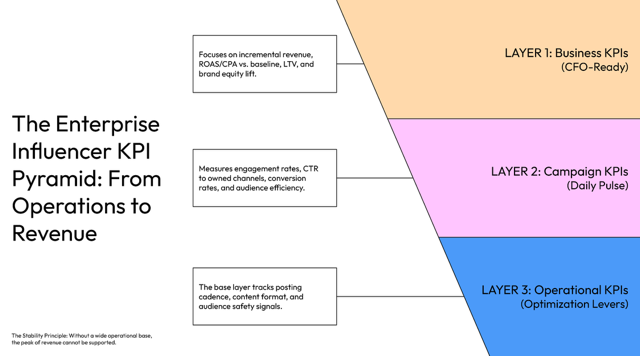
- Layer 1 → Business KPIs: revenue, ROAS, LTV
- Layer 2 → Campaign KPIs: conversions, efficiency, audience overlap
- Layer 3 → Operational KPIs: posting cadence, audience quality, content performance
CMO’s who wire these together don’t just prove performance, they build systems to scale it.
QBR, slide 7. The CEO glances at your influencer dashboard and asks “How much revenue did that creator campaign actually generate?”
You have impressions. Engagement rates. A #hashtag that gained traction. But not the number that justifies next quarter’s budget.
The issue isn’t lack of data. It’s lack of structure. Most brands track outputs (posts, impressions, engagement) when the board demands outcomes (revenue, margin, CAC).
Result? Influencer marketing stays experimental while paid search gets line-item status.
The statistics back this: 26-60% of marketers cite ROI measurement as their primary obstacle. The brands that solve it generate $5.78 revenue per dollar spent, with top campaigns hitting $18-20 per dollar. That’s 11x the ROI of traditional digital advertising. But you must measure it correctly to claim it.
The fix? A 3-layer influencer marketing KPI system that starts with business outcomes and works backward to execution.
The KPI Hierarchy: Your Three-Layer Framework
Most brands build KPI lists like bad playlists. No flow, no structure. Just numbers in a spreadsheet. Here is how we, at The Shelf, like to think of the framework:
LAYER 1: Business KPIs (CFO-Ready)
These are your north-stars. If they move, the business moves.
- Incremental Revenue: Real lift, not just traffic
- ROAS or CPA vs. baseline: If this isn’t competitive with search, it won’t get funded
- Lifetime Value (LTV) of Acquired Customers: Are influencer-acquired buyers higher-value?
- Brand Equity Lift: Awareness, consideration, preference, you can and should measure this
This is the language of finance. When you speak it fluently, your budget stops being questioned.
LAYER 2: Campaign KPIs (Your Daily Pulse Check)
- Engagement rate: Normalize it. Micro = ~6%, Macro = ~1-2%.
- Click-through rate (CTR) to Owned Channels: Quality of volume
- Conversion Rate from Creator Traffic: Self-explanatory
- Audience Overlap/Efficiency: Are you wasting spend on overlapping audiences?
These are your early indicators. When they move, revenue follows.
LAYER 3: Operational KPIs (Optimization Levers)
- Posting Cadence
- Content Format (Reels > Static)
- Audience quality and safety signals
Fix issues here before they snowball into missed targets.
Gamechanger: Connect the Layers
Most brands measure all three separately. The power is in wiring them together.
You set business targets first, translate those to campaign KPIs, then monitor operational KPIs daily to stay on track. Enterprise CMOs follow this flow:
- Operational slip → Campaign warning → Business risk
- Campaign overperformance → Operational reinforcement → Business upside
Weekly operational reviews catch issues before they hit revenue. Monthly campaign reviews reallocate budget mid-flight. Quarterly business reviews update forecasts.
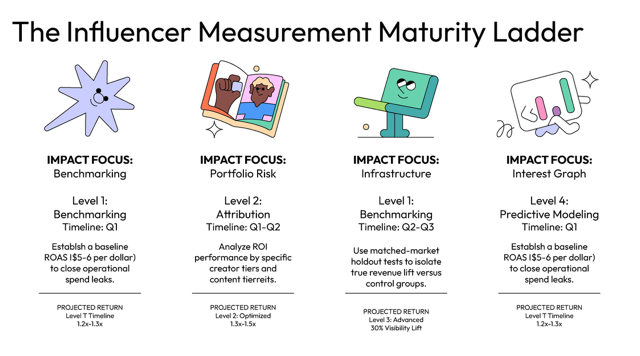
The Maturity Ladder: Your Path to Predictability
Enterprise influencer marketing measurement is a marathon, not a sprint. You can’t go from “We posted with some creators,” to “We have AI-powered predictive ROAS models’ in one quarter.”
Here’s the proven path:
- Level 1: Channel-Level Benchmarking (Quarter 1: proving baseline ROAS of $5-6 per dollar)
- Level 2: Campaign-Level Attribution (Quarters 1-2: identifying which creators and formats drive revenue)
- Level 3: Incrementality Testing (Quarters 2-3: measuring true lift with holdout groups)
- Level 4: Predictive Modeling (Quarters 3-4+: forecasting revenue before campaigns launch)
Here is what this translates to in a detailed roadmap:
Maturity Level 1: Channel-Level Benchmarking
Timeline: Quarter 1
What you measure: ((Total influencer spend) ÷ (Total attributed revenue))
Data you need: Basic UTM tracking, platform reporting
The CFO question you answer: “Are we at least in the ballpark compared to paid search?”
Early on, you’re not chasing perfection. You’re validating that influence drives revenue. A $5-6 return per dollar spent tells you this isn’t experimental spend. It’s a scalable growth lever.
Maturity Level 2: Campaign-Level Attribution
Timeline: Quarters 1-2
What you measure: Individual campaign ROAS, CPA, time-to-conversion
Data you need: Pixel tracking, CRM integration, holdout groups
The CFO question you answer: “Should we scale this creator or optimize elsewhere?”
This is where you get surgical. You’re not just measuring “influencer marketing worked”, you’re measuring which influencers, which formats, which audience segments drove revenue.
Real example: Campaign-level tracking separates winners from others. One footwear client we worked with discovered their Crocs activation generated triple the expected engagement while their holiday vlog campaign drove 150,000+ views. By monitoring performance weekly, not monthly, they reallocated budget mid-quarter toward high-performing formats and hit $0.14 CPC with whitelisting. That’s the power of surgical visibility: you’re not guessing which creators work; you’re optimizing in real time.
See how the campaign unfolded.
Maturity Level 3: Incrementality & Brand Lift
Timeline: Quarters 2-3
What you measure: Incremental revenue (test vs. control), brand lift from surveys, cross-channel attribution
Data you need: Multi-touch attribution platform, brand tracking studies, sales cohort data
The CFO question you answer: “Is this creating new customers, or just reshuffling the ones we already had?”
Your ROAS might look great, but if you’re just pulling forward demand or stealing from other channels, that’s not growth, that’s channel cannibalization. Incrementality tests (holdout groups, geo-splits, synthetic control) tell you the truth. 70% of the brands that run incrementality tests discover their influencer campaigns are generating true incremental lift.
Brand lift studies tell the other half of the story. Did awareness shift by 8 percentage points? Did consideration among your target demo jump 12%? That’s future revenue in the pipeline.
Maturity Level 4: Predictive & Scalable
Timeline: Quarters 3-4+
What you measure: Revenue forecast per creator tier, Predicted ROAS before launch, LTV cohorts
Data you need: Historical campaign library, ML models, audience quality signals (hello, Interest Graph)
The CFO question you answer: “If we invest $2M in micro-creators next quarter, how much revenue will we generate?”
You’ve built enough historical data that you can predict performance before the campaign even launches. You know that creator tier A generates 7.2x ROAS on average, tier B generates 4.8x, and tier C is hit-or-miss at 3.1x.
You can model scenarios. You can forecast. You can get the budget approved in advance because finance trusts your numbers.
The brands that reach Maturity Level 4 treat influencer marketing like a science and they get funded accordingly.
Operational Cadence: Making it Real
Good governance turns framework into execution.
Weekly operational reviews catch problems before they become revenue misses, monthly campaign health checks reallocate budget to high-performers mid-flight, and quarterly business impact reviews update benchmarks and inform next quarter’s strategy.
Before Launch: The “No Surprises” Contract
Before a single creator posts, your team sits down with finance and the CEO to define:
- Your north-star metric
- Your success benchmark
- Your reporting cadence
Everyone agrees. You document it. No one gets to move the goalposts mid-campaign because the CEO saw a competitor’s viral TikTok and now wants “more engagement.”
Weekly (In-Flight): Catch Problems Before They Become Disasters
Every Monday morning, your team reviews operational KPIs:
- Content performance by format
- Audience quality scores
- Posting cadence
If something is off, you diagnose it immediately and have 5 days to fix it before it becomes a revenue miss.
Monthly: The Campaign Health Check
End of month, you pull campaign KPIs:
- ROAS or CPA vs. target
- Conversion rate from creator traffic
- Audience efficiency
If a campaign is underperforming, you don’t wait for the quarter to end. You reallocate the budget. You pause the underperformers and double down on the winners.
Quarterly: The Business Impact Deep Dive
Every quarter, you go deep:
- Incremental revenue
- LTV cohorts
- Brand equity shifts
You compare against other channels. You update your playbook. You set new benchmarks for next quarter.
The Shelf Advantage: Why Interest-Driven Matching Changes Everything
Here’s where most enterprise measurement breaks.
You’ve got the framework. You’ve got the KPI hierarchy. You’ve got buy-in from the board. But your data is still noisy.
Why? Creator-audience mismatches.
Let’s say you’re running 80 creators. Some have authentic, engaged audiences that align perfectly with your product. Others have follower decay, bot networks, or demographic drift. Your ROAS report lumps them all together, and you can’t tell which creators are actually driving value until 30 days of data and budget are already gone.
This is where Interest Graph technology flips the script.
Instead of matching creators to brands based on follower count or engagement rate, The Shelf’s platform matches based on actual audience interest alignment. We’re talking psychographic fit, not just demographics. We’re talking ML-powered risk detection that flags fake followers, brand-safety risks, and content misalignment before the campaign launches.
Result: Cleaner data. Faster attribution signals. More predictable ROAS.
And when the data is clean, the KPIs become crystal clear. You catch winners faster. You kill losers faster. You optimize in real time instead of waiting for the post-campaign autopsy.
Risks that Break the KPI System
Influencer marketing KPI frameworks promise structure. Execution reveals structural risks.
1. Short-Term Efficiency Can Undermine Long-Term Value
Optimizing exclusively for CPA or ROAS attracts low-LTV, promotion-driven buyers. You win the quarter. You weaken the year.
What to do instead: Pressure-test performance against LTV and brand alignment. 12x ROAS means little if customers never return.
2. Attribution Is Directional, Not Absolute
Multi-touch models improve accuracy. Incrementality testing improves it further. None are perfect. You work with informed estimates, not certainty.
What to do instead: Build decisions around directional accuracy. 80% confidence is often enough to scale responsibly.
3. Influencer and Search Do Different Jobs
Search captures existing demand. Influencer marketing shapes it. Comparing ROAS in isolation ignores their roles.
What to do instead: Show how influencer marketing lifts branded search, direct traffic, assisted conversions. Growth happens across channels.
4. Single-Metric Optimization Creates Blind Spots
Engagement alone does not guarantee revenue. ROAS alone does not measure brand equity. Reach alone does not indicate influence.
What to do instead: Track business outcomes, campaign performance, operational efficiency together. Strength is in the system.
Your 30/60/90 Days Implementation Plan
Next 30 Days: Audit
- Map current KPIs to 3-layer framework
- Identify gaps (most miss Layer 3 entirely)
- Get cross-functional alignment
Next 60 Days: Build
- Implement campaign ROAS tracking (UTMs, pixels, CRM)
- Run one holdout test (geo-split minimum)
- Build monthly KPI dashboard
Next 90 Days: Scale
- Set Q2 targets based on Q1 data
- Run Q1 post-mortem and update playbook accordingly
- Forecast Q3 spend using business KPIs
From Influencer Marketing Assumptions to Revenue Proof
The board won’t keep funding a channel that’s not measurable. The board won’t approve next quarter’s budget based on engagement rates. The board won’t care that your TikTok went viral if you can’t tie it to revenue.
But influencer marketing is measurable. The brands winning in this channel aren’t smarter than you. They didn’t get lucky. They built better systems.
They moved from, “We have 47 metrics in a spreadsheet,” to, “We have five KPIs that matter.” From, “We think this campaign worked,” to, “We know this generated $4.2M in incremental revenue with a 7.8x ROAS”. From 80 hours of reporting to 8 hours. And actually using that time to optimize, not document.
That’s enterprise-grade measurement. That’s how influencer marketing stops being a pilot and starts being a predictable, fundable, scalable growth channel.
And when you get there? That’s when boards stop asking “Why are we doing this?” and start asking “How do we do more of this?”The Shelf builds data-first influencer marketing systems that connect creator content directly to incremental revenue. Schedule a strategy call with our team to request a custom attribution audit for your next multi-channel campaign.