12 Products That Will Get A Big Boost In Sales This Fourth Of July
It’s time for summer’s biggest, baddest holiday – the Fourth of July. Every year, more than 200 million Americans gear up to partake in the nationwide festivities that mark the anniversary of our country’s independence. And every year, a short list of [somewhat] patriotic products (craft beer is patriotic, right?) make their way into the hands of Americans as part of the official holiday celebration.
This year, we thought we’d take a look at some of the products that have, no doubt, already shown up either in your social media feed or as creepily intuitive smart ads following you around the World Wide Web. These are products that generate a significant amount of their annual revenue during the $6.8 billion Fourth of July holiday buying frenzy.
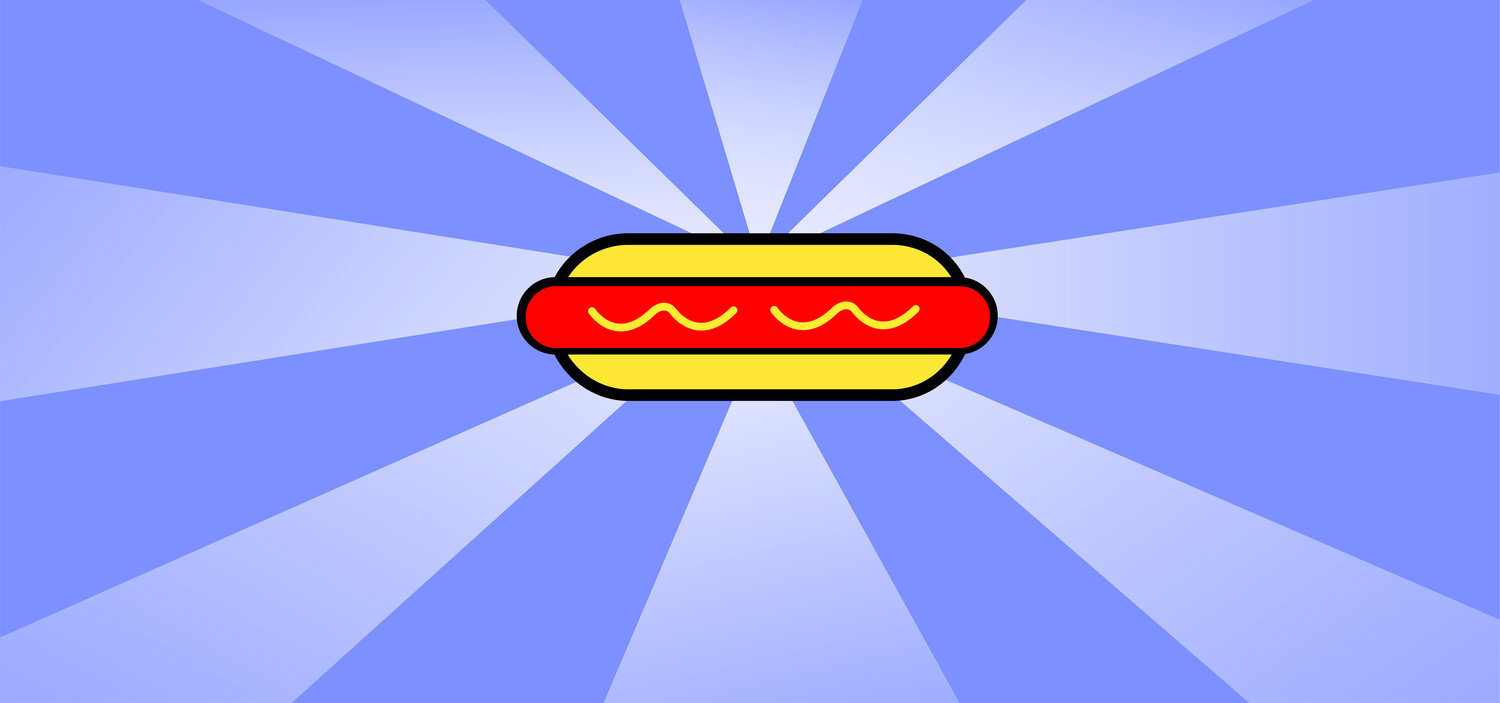
Hot Dogs
Summertime is hot dog season! That’s pretty straightforward right? Ball games, amusement parks, grills, and leisurely walks through the streets of New York all seem to demand we eat more hot dogs.
In 2016, we spent more than $2.4 billion buying 1 billion pounds of hot dogs, according to the National Hot Dog and Sausage Council. This doesn’t include the hot dogs we get from street vendors or the dogs we buy when we’re out and about. This is just what we spent on the hot dogs that made it onto our grocery lists.
Americans typically eat around 7 billion hot dogs during the summer months that fall between Memorial Day and Labor Day, 150 million of those hot dogs we eat on the Fourth of July.
Since a full 10% of the year’s annual hot dog revenue is generated in July, it’s no wonder July been designated as National Hot Dog Month.
Fun fact: One-third of the hot dogs produced in the US come from Iowa. Thanks, Iowa!
Barbecue Sauce
Fun fact: Heinz put the first commercial barbecue sauce in stores in 1948 but recipes for barbecue sauces can be found as early the 17th century. Today, there are dozens of barbecue sauces lining the shelves of major grocers.
Statista listed Sweet Baby Ray’s as the top-selling brand with $151.6 million in sales in 2015. Kraft came in a distant second at $69.8 million. This gap likely contributed to Kraft’s decision to release five new sauces ahead of last year’s summer barbecue season. According to Ad Age, the new sauces could also help Kraft stay ahead of smaller barbecue sauce producers.
To get an idea of the significance of Sweet Baby Ray’s sales, consider this: Americans bought $436.7 million in barbecue sauce in 2014 and $448.56 million in 2015. Nielsen reports Americans will consume $42 million in barbecue sauce for the 4th of July.
Barbecue
About two-thirds of celebrants will attend a barbecue, cookout, or picnic for the Fourth of July. The average household spends more than $70 on food they plan to eat on the Fourth of July holiday.
In the weeks before the July 4th holiday, Americans buy 700M pounds of chicken and 190M pounds of beef. Here are some quick stats published by Nielsen. To celebrate Independence Day, Americans will consume:
- $318 million in chips
- $133 million in hamburger and hot dog buns
- $116 million in cherries
- $114 million in deli salads
- $83 million in watermelon
- $37 million in ketchup
- $36 million in corn on the cob
- $28 million in bakery pies
- $27 million in Italian sausage
- $25 million in bratwurst
- $25 million in mustard
Barbecue Grills
Three in every four U.S. adults (not households – but adults) own grills or smokers. This is as true for palatial estates as it is for inner city bungalows. Americana definitely supports the practice of cooking food outside. In fact, one article I came across actually positioned the outdoor kitchen as the next hot amenity.
Of the estimated 181 million grill owners in the US in 2015, 76% planned to fire up their grills for the Fourth of July, and 45% intended to buy a new grill within a year. The majority of grill owners (62%) own gas grills, followed by charcoal (53%), then electric (12%).
Mosquito Repellent
The big Zika scare of 2016 sent mosquito repellent sales through the roof. Not only were stores selling more product, but the seasonal demand for repellents started earlier in the year in 2016 than it did 2015.
Between February and April 2016, insect repellent sprays were up 323% over what they were for the same period in 2015, jumping from $1.4 million to $5.9 million in that three-month period. More units sold and the average price per unit increased from $10.28 in 2015 to $12.66 in 2016. And that was before Zika ever hit U.S. soil.
In response to the increased demand last year, SC Johnson (manufacturer of Off!) increased production by running factories around the clock.
Earlier this year, Zion Market Research published a press release that estimated the insect repellent market to be valued at $3.2 billion. That number is expected to climb to $5 billion by 2022.
Coincidently, according to Consumer Reports, if you’re looking for a way to stay bite-free this summer, skip the wearable devices and the candles. Instead, go for a repellent that contains oil of lemon eucalyptus (OLE) or deet.
Apparel
Don’t let the jet-setting super models and international fashion runways fool you. The US apparel market is the largest in the world. In 2015, the market was valued at more than $350 billion, according to Statista; the US imported $88 billion in clothes.
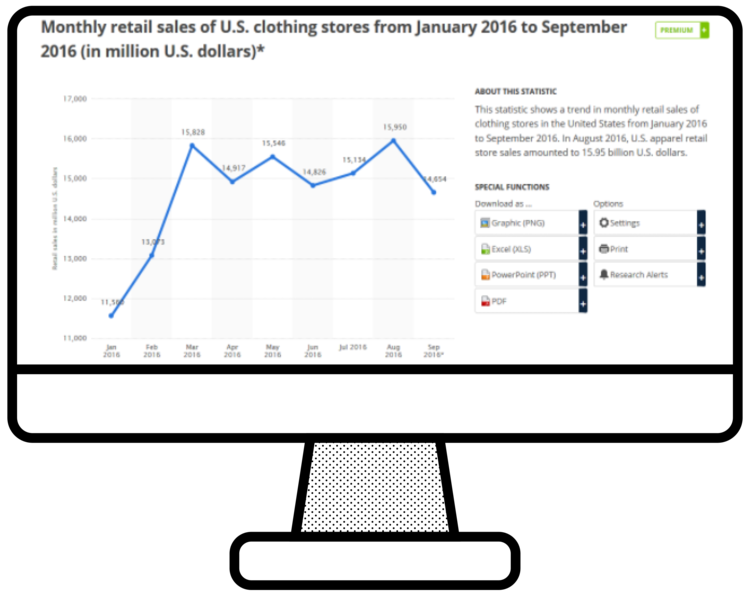
In 2016, July accounted for $15.15 billion in apparel sales, up from $14.82 billion in June. The increase in spending can easily be attributed to two factors – Fourth of July spending to beef up vacation and summer wardrobes, and the other side of the coin, which is the start of back-to-school shopping, which typically begins at the end of July (in the South, the kids go back to school the first or second week in August).
Soft Drinks
In 2014, the US non-alcoholic beverage market produced 30.9 billion gallons of drinks. Believe it or not, that’s less than what the industry produced just a few years before. Americans are actually buying fewer sugary drinks.
Four years ago, the average American drank 44 gallons of soft drinks per year. Nineteen years ago, the average American drank 58 gallons of soft drinks a year. Americans spent $65 billion on soft drinks in 2011. About a billion of that ($1.14 billion) we bought just to celebrate the Fourth of July.
Harvard Health reports that US beverage companies spent $3.2 billion just marketing carbonated beverages in 2006, with a significant amount of that budget allocated to marketing to kids ages 2 – 17 years of age.
So, as for the tug-of-war currently taking place between the beverage industry and nutrition-focused watchdog groups, it is true that sugary drinks have been linked to an increase in obesity. On the other hand, the beverage industry employs 240,000 people and creates $166.5 billion in annual revenue.
Hard Drinks
Welcome to the biggest drinking holiday of the year! Americans will drink plenty of beer this Fourth of July. This is particularly true of American men in their 20s and 30s, who make up the largest demographic of beer drinkers.
In 2013, more than 103 million Americans drank beer on the Fourth of July, with 68.3 million cases of beer sold over the course of the weekend. In 2015, Americans spent an estimated $1 billion on beer to celebrate Independence Day.
Just last year, Nielsen expected Americans to consume $1.72 billion in beer, flavored malt beverages, and cider (which is growing in popularity in the US, Canada, and the UK). That includes 60.7 million cases of domestic beer and 10.7 million cases of imported beer. As well, celebrants were expected to spend $568.3 million in wine for the Fourth of July 2016 festivities.
To put these random numbers in perspective, the National Beer Wholesalers Association offers these stats:
In 2015, the U.S. beer industry sold 206.7 million barrels of beer, the equivalent of more than 2.8 billion cases of twenty-four 12-ounce servings. In addition, the industry shipped approximately 2 million barrels of cider, equivalent to more than 28.3 million cases.
That’s a heck of a lot of beer. Most Americans drink domestic. Imported beers – which come from more than 100 different countries – only made up 14% of total beer consumed in 2014.
The popularity of craft beer is also gaining momentum. In 2014, more than 22 million barrels of craft beer were produced for Independence Day, according to the Brewers Association. Craft beer now accounts of 18% of the total beer market and craft beer breweries doubled production of beer from 10.1 million barrels to 22.2 million barrels between 2010 and 2014.
The beer industry is even bigger than the non-alcoholic beverage industry. According to the Beer Institute, the beer industry will add $250 billion to the nation’s economy, generate $48.5 billion in tax revenue, pay $79 billion in wages and benefits, and employ 1.75 million Americans each year.
American Flags
A friend of mine who has been a US citizen for several decades now once told me that one of the reasons he loves America is because Americans love America. My friend marveled at the fact that there is actually a market for Americans to buy the American flag at the local store for personal use. We proudly hang our flags on our front porches. He said where he’s from, the government is so corrupt and the citizens so poor, no one would dream of displaying the country’s flag.
Stateside, however, $4.4 million was spent on imports of U.S flags in 2015. American flags are still big business. Last year’s surge in demand for American flags was fueled by a tight presidential race and a rise in patriotism.
The one irony about the American flag is chances are pretty good that the flag you buy from your local store was actually made in China.
In addition to getting our fireworks from China, it seems we also import nearly 98% of our flags from China. The Defense Department is the only government agency required to use flags that were produced on US soil. The “All-American Flag Act” – which would require the US government to use American-made flags for official business – has failed repeatedly.
The government thinks American-made flags are too expensive.
As Dame Dash would say (out loud), “Pause.”
Nevertheless, of the 48 million Americans US News says will be shopping for decorations, apparel, and party supplies for the Fourth of July, 66% of them will display the American flag in honor of Independence Day.
Fun fact: At the turn of this century, Roadside America listed the late Thomas “Ski” Demski as the owner of the largest American flag. The flag was 505 feet by 225 feet, weighed 3,000 pounds, and it took 500 people to unfurl.
Consumer Fireworks
There’s good news on the pyrotechnics front. This year, the number of states that do not allow consumer fireworks has been whittled down to three tiny states along the eastern seaboard – Delaware, Massachusetts, and New Jersey. Residents of the remaining 47 states and Washington, DC can now legally contribute to the $755 million in consumer fireworks USA Today says are purchased by regular Joes like my neighbor (because I’m still recovering from the Great Sparkler Incident of 1988) every single year.
In 2013, the average American planned to spend $28 on personal fireworks. People in the Northwest and East planned to spend about $17, while those in the South and Midwest planned to spend an average of $36 and $35, respectively. And of course, whatever Mom is spending on fireworks, expect Dad to spend twice as much (Visa, Inc. 2013 Fourth of July Spending Survey).
Display Fireworks
Last year, the kids and I skipped the municipal fireworks shows (including the light show at Stone Mountain Park, which is usually pretty awesome) in favor of what I thought would be a low-key, quick-and-dirty, cozy little fireworks display at the nonprofit around the corner.
What we saw was nothing short of amazing. I don’t remember seeing a more dynamic fireworks display in recent history and I didn’t realize “the nonprofit around the corner” could even get their hands on such a varied arsenal fire power.
I don’t even know where they could have been shooting these things off. I always though fireworks that big had to be shot from a barge in the river that separates the US from Canada (I’m from Michigan).
Local government, community organizations, and the fine folks at Macy’s (who shoots off 56,000 effects every Independence Day according to Fox Business) spend $340 million a year on large-scale display fireworks. There are approximately 15,000 fireworks displays across the country to celebrate the July 4th holiday. The U.S. imports 24.6 million pounds of display fireworks annually, most of which come from China.
That sounds big until you find out we import 260.7 million pounds of consumer fireworks every year. Altogether, we spend over a billion dollars a year on pyrotechnic displays.
Travel
Most Americans will choose to celebrate the Fourth from their home base which is understandable. The Fourth of July is one of the most popular times to travel, but it’s also one of the most expensive.
You know the drill: In the days leading up to a major federal holiday, gas prices will start to rise. Airfare usually starts going up in the weeks before the holiday. In 2014, the average price of a plane ticket was $384 one-way for Fourth of July weekend.
Still, Wallethub.com estimates more than 40 million Americans will take a trip of 50+ miles to celebrate Independence Day, and the large majority of travelers (85%) will drive.
So, there’s the skinny – our take on the traditional “Fourth of July by the Numbers” post. Whether your holiday marketing strategy focuses on social media promotions or the world’s most awesome sidewalk sale, this post should provide you with a bit more insight on who’s buying what this Fourth of July holiday season.